“The four best predictors of mortality are unchanged from fifty years ago. They’re still:
- VO2 max
- leg strength
- lean body mass
- grip strength”
This is an unreferenced statement from the book Unplugged. I want this to be true and therein lies the danger. I have used this quote in presentations because I trust Dr. Andy Galpin and very much still do. I asked the authors multiple times for a reference/s over a six month period and crickets. In their defense, I might not be able to find an exact reference to something I co-wrote for popular media a few years ago and DMs aren’t the most reliable mode of communication so let me give it the ol’ college try.
I wanted to start by comparing social isolation/social connection, obesity, and smoking to the factors above. I am going to cherry pick here and am 100% up for someone ripping this apart.
“Across studies in which several possible confounds were statistically controlled for, the weighted average effect sizes were as follows: social isolation odds ratio (OR) = 1.29, loneliness OR = 1.26, and living alone OR = 1.32, corresponding to an average of 29%, 26%, and 32% increased likelihood of mortality, respectively.”
Holt-Lunstad et al. 2015 PMID:25910392
“Adjusted hazard ratios for all-causes death in smokers compared with never smokers were 1.3 (95% confidence interval, 1.2-1.4) for smokers of less than 10 cigarettes per day and 1.8 (95% confidence interval, 1.7-1.9) for smokers of 10 cigarettes per day or more.”
Jacobs et al. 1999 PMID:10218754 (We’ve known smoking is bad for a while)
Obesity is a bit harder to disentangle from the variables above. The Obesity paradox which gained a lot of steam in 2005 from a JAMA article has not stood the test of time and looks to be to be at least partially (cough…mainly) explained by the retention of lean body mass.
Nevertheless, it does look like as BMI increases above the obese range things are pretty neat and tidy with risk of dying.
“A monotonic association was observed between maximum BMI and mortality, with increasing risks observed across obese I (BMI of 30 to <35; hazard ratio [HR], 1.27; 95% CI, 1.14-1.41) and obese II (BMI of 35 to <40; HR, 1.93; 95% CI, 1.68-2.20) categories. A significant association was not observed for the overweight category (BMI of 25 to <30; HR, 1.08; 95% CI, 0.99-1.18).”
Xu et al. PMID: 30646366
But, nearly everything gets wicked cool for the muscle-confirmation-bias-meat-stacked humans when we look at the figure below from Abramowitz et al. 2018 PMID: 29641540
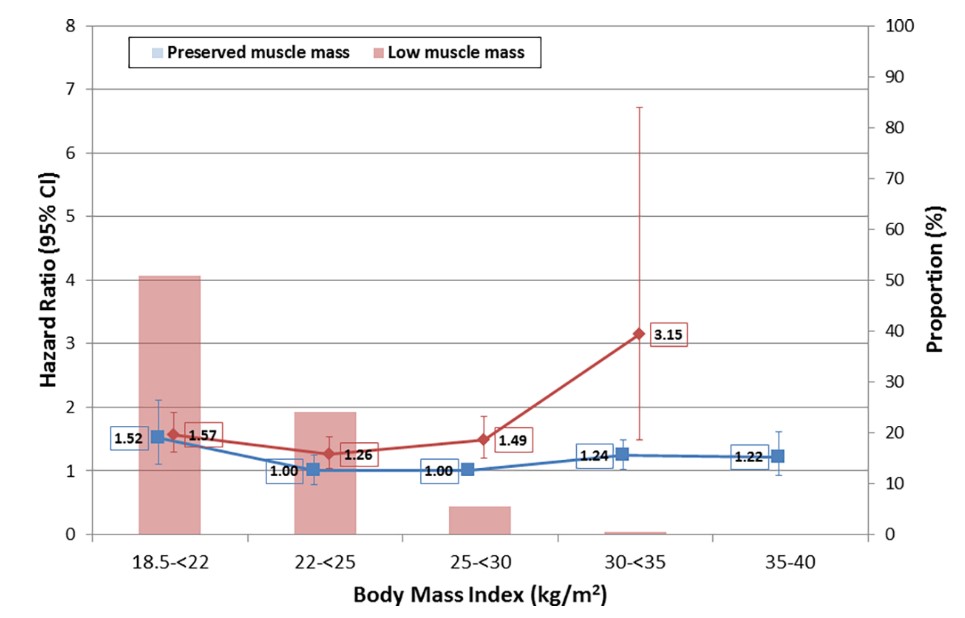
The retention of muscle mass was extremely protective of all-cause mortality across BMI categories. Interestingly, being skinny, but not fat at a BMI of 22-25 showed nothing so if you are a runner without a ton of muscle mass and you like running probably all good. But, if you are overfat with a bunch of other risk factors at a BMI between 22-25…I am not going to take that bet.
Now onto the strength markers which are much harder to compare to real-life gym measures because they are usually compared in tertiles. Meaning we divide a massive group of humans into three equal groups and then compare the strongest people to the weakest people as we don’t have pre-determined cut-offs for grip or knee extension strength. Perhaps eventually we might see the ability to trap bar deadlift one’s body weight as a longitudinal marker and this would be a lot more real world helpful. But, my hunch is you would be very much in the clear here and the bar is probably significantly lower and may just be the ability to lift a suitcase, but let’s not go there. I’m already triggered.
“Grip strength had the largest HR with mortality (HR = 1.83; 95% CI = 1.51–2.22), followed by grip strength divided by body mass index (HR = 1.50; 95% CI = 1.24–1.82) and grip strength divided by body mass (HR = 1.46; 95% CI = 1.21–1.76).”
Whitney et al. 2019 PMID:30666214
When comparing this to the factors above we see it is up there with smoking more than 10 cigarettes a day, so if Betty Lou is passive-aggressively bitching at Stanley to stop smoking and Betty Lou can’t open her soda and has no one who likes her enough to help her open her soda pop…we have a problems.
The figure below shows changes in VO2 Max over a 13.3 year period and the hazard ratio. There are going to be lots and lots of cofounders here and the researchers attempted to control for them in the analysis. All I can say is DAMN!!!!

Laukkanen et al. 2016 PMID: 27444976
“Our meta-analysis shows that adults with higher muscular strength levels, measured by handgrip strength test, had a 31% reduced all-cause mortality risk (HR 0.69, 95% CI 0.64-0.74) compared with those adults with lower muscular strength, with a slightly stronger association and lower heterogeneity in women than men. Similarly, adults with higher knee extension strength levels had a 14% lower risk of death (HR 0.86, 95% CI 0.80-0.93) than adults with lower strength levels. Therefore, low muscle strength levels should be considered a risk factor for all-cause mortality in adults.”
Garcia-Hermoso et al. 2018 PMID: 29425700
Thus, if we invert the hazard ratio the low grip strength would be 1.44 and the low knee extension group would be 1.16.
As you can see with a very back of the napkin and cursory dig into the literature it is very hard to concretely and simply make the bulleted statement above. That said, it looks like it is a very bad idea to let yourself get out of shape and lose muscle as you age. (Confounders come along for the ride here as well, think cancer, upper respiratory infections, HIV, etc.)
To make this practical, I think we pull the Big Enough number from the Abramowitz et al. paper and you could calculate and track this via DEXA really easily as you age and you would be able to check in on bone mineral density as well #bonus.
“Low muscle mass was defined as appendicular skeletal muscle mass of <5.45 kg/m2 in women and <7.26 kg/m2 in men.” AKA muscle on your arms and legs.
- 9 m male (6’3”) = 26.2 kg of muscle = 57.6 lb of muscle
- 8 m male (5’11”) = 23.5 kg of muscle = 51.7 lb of muscle
- 7 m male (5’7”) = 21 kg of muscle = 46.2 lb of muscle
- 7 m female (5’7”) = 15.8 kg of muscle = 34.6 lb of muscle
- 6 m female (5’3”) = 14.0 kg of muscle = 30.7 lb of muscle
VO2 Max I think you can just track as you age. Maybe use a 2k row as an alternative, but even the ability to maintain any kind of pace on a 2k row probably puts you out of the danger zone anyways. Concept 2 has a free calculator on their site.
As for strength, I really have no idea. Have a stronger handshake than all the other older people.
Recent Comments